What are TSM’s?
Tenant Satisfaction Measures (TSMs) are performance measures that all providers of social housing must report upon in a bid to drive up standards for customers and give them a better understanding of how we are performing as a landlord. The measures will give you, our customers, improved visibility and the ability to hold us to account when things don’t go right. Each landlord is required to publish their results annually, starting in Summer 2024, to give customers the opportunity to compare their landlord with others in the same sector.
There are 26 measures in total and they are split into 2 parts. 14 Management Information measures and 12 Tenant Perception measures, the latter being collected through surveying our customers directly. You can find more details of the TSM’s and why they have been introduced on the gov.uk website here.
The TSMs cover the following key areas:
Our Results
Below, you’ll find our full reports for the Tenant Perception and Management Information measures that together form the TSMs.
You can also see more about our approach – how we’ve gathered this information and who we’ve gathered it from.
You can also read our full Telephone Survey script to see exactly how we ask these questions.
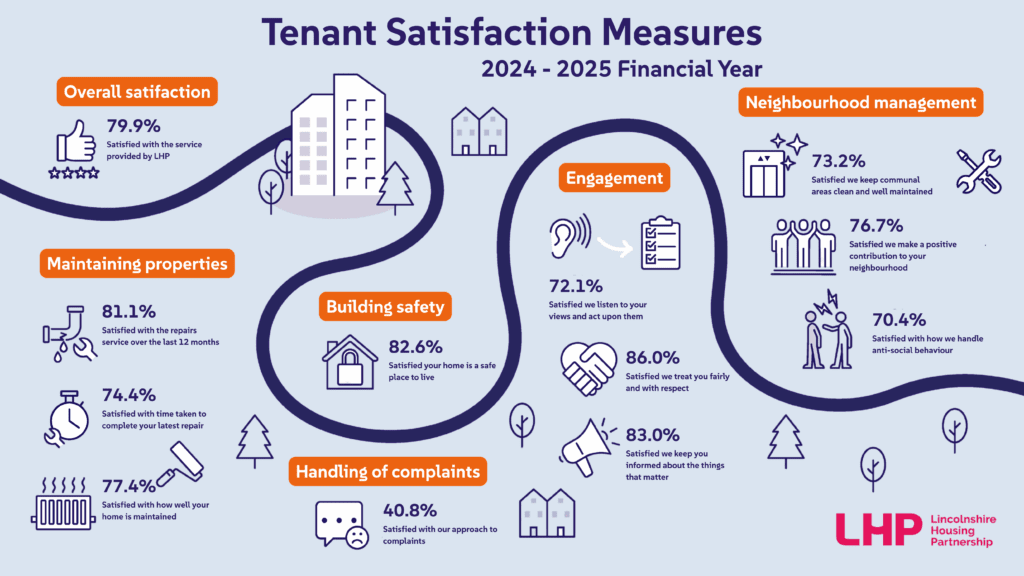
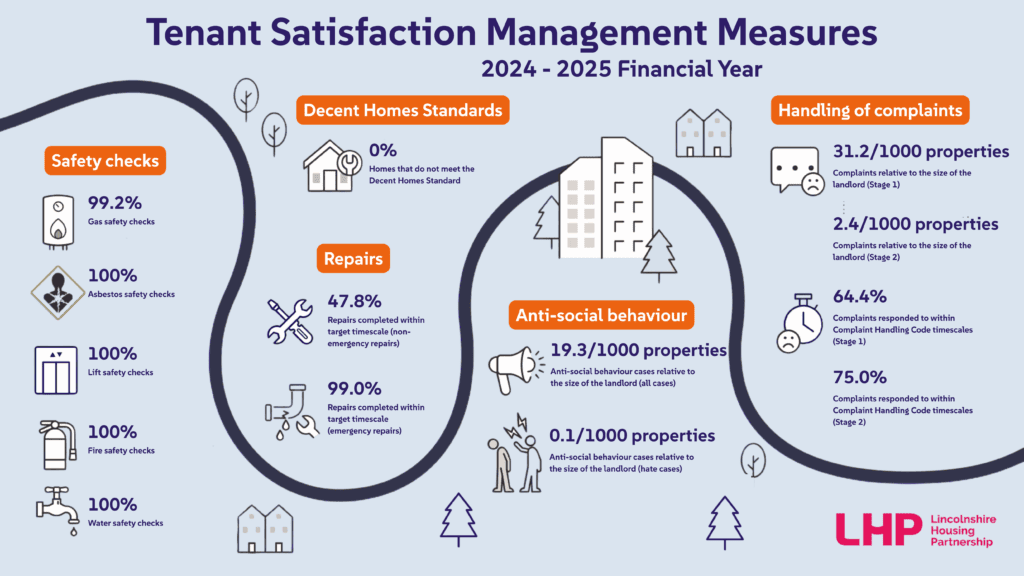
You can see a summary of our latest TSM results below:


Tenant Perception Measures
| Measure | Proportion of customers who report that they are satisfied - 2023/2024 | Proportion of customers who report that they are satisfied - 2024/2025 |
|---|---|---|
| How satisfied are you with the service provided by LHP? | 82.7% | 79.9% |
| How satisfied are you with the overall repairs service from LHP over the last 12 months? | 85.1% | 81.1% |
| How satisfied are you with the time taken to complete your most recent repair after you reported it? | 79.6% | 74.4% |
| How satisfied are you that LHP provides a home that is well maintained? | 82.2% | 77.4% |
| Thinking about the condition of the property or building you live in, how satisfied are you that LHP provides a home that is safe? | 85.6% | 82.6% |
| How satisfied are you that LHP listens to your views and acts upon them? | 73.8% | 72.1% |
| How satisfied are you that LHP keeps you informed about things that matter to you? | 83.6% | 83.0% |
| To what extent do you agree with the following: "LHP treats me fairly and with respect"? | 87.5% | 86.0% |
| How satisfied are you with LHP's approach to complaints handling? | 40.4% | 40.8% |
| How satisfied are you that LHP keeps these communal areas clean and well maintained? | 67.4% | 73.2% |
| How satisfied are you that LHP makes a positive contribution to your neighbourhood? | 73.5% | 76.7% |
| How satisfied are you with LHP's approach to handling antisocial behaviour? | 70.4% | 70.4% |
Management Information Measures
| Key Performance Indicators | 2023/24 Year End Value | 2024/25 Year End Value |
|---|---|---|
| Gas safety checks | 99.5% | 99.2% |
| Fire safety checks | 100% | 100% |
| Asbestos safety checks | 100% | 100% |
| Water safety checks | 100% | 100% |
| Lift safety checks | 100% | 100% |
| Complaints relative to the size of the landlord (Stage 1) | 28.2 / 1,000 properties | 31.2 / 1,000 properties |
| Complaints relative to the size of the landlord (Stage 2) | 0.9 / 1,000 properties | 2.4 / 1,000 properties |
| Complaints responded to within Complaint Handling Code timescales (Stage 1) | 92.5% | 64.4% |
| Complaints responded to within Complaint Handling Code timescales (Stage 2) | 100% | 75.0% |
| Anti-social behaviour cases relative to the size of the landlord (all cases) | 23.9 / 1,000 properties | 19.3 / 1000 properties |
| Anti-social behaviour cases relative to the size of the landlord (hate cases) | 0.3 / 1,000 properties | 0.1 / 1000 properties |
| Homes that do not meet the Decent Homes Standard | 0% | 0% |
| Repairs completed within target timescale (non-emergency repairs) | 57.5% | 47.8% |
| Repairs completed within target timescale (emergency repairs) | 97.6% | 99.0% |
Repairs Target Timeframes
Below are listed the target timeframes used for our repairs service during 2024/25:
Emergency Repairs – the maximum target timeframe for a repair that is classified as an emergency is 24 hours. Under certain circumstances we also operate an additional four-hour target timeframe too.
Non-Emergency Repairs – the maximum target timeframe for a repair that is classified as a non-emergency is 60 days. Under certain circumstances we also operate additional 3 day and 20 day target timeframes too.
Summary of Approach
To support with the publication of our TSM results, we outlined a summary of the approach we have taken to arrive at the results. In accordance with the Regulator for Social Housing guidance, our customer population meant we could not practically contact all, therefore, we adopted a random, stratified sampling approach with quotas based on tenure type, location and age of customers. These groups were selected to ensure we had a fair cross section of our customers views.
This means that the percentage of satisfied customers we report is based only on the responses from a sample group, around 8% of our total customer base, not the entire customer population.
You can find out everything about our Summary of Approach on the page below.
Why is this happening?
In 2020, the government published the charter for social housing residents: social housing white paper, which sets out ways to improve things for people living in social housing.
One of those improvement measures is bringing in a set of tenant satisfaction measures.
These measures will:
- let customers see how well their landlord is doing
- gives the government and the Regulator an idea of which landlords might need to improve things.
When did this start?
This started in April 2023, when all housing providers had to start to collect data around the 26 measures. We’re achieving this by surveying our customers, and every summer, we’ll report this information to the Regulator for Social Housing and publish it on our website.
Our survey partners, Acuity, contact customers to collect feedback and report this data to us on a quarterly basis, along with some additional questions, which give us more insight into your experience of our services. This then gives us a clear picture of areas we need to work on, to improve your experience with us.
Calls from Acuity are genuine and calls will only come from this telephone number: 01273 093939
If you’d like to find out more about Acuity, you can read our page to learn more about Acuity or you can visit their website.